Many of you are probably aware that carriers that have hubs try to schedule their flights in bursts to maximize connecting traffic — a bank of flights all arrive, there’s pandemonium for 90 minutes, and then huge bank of flights depart. This is efficient network planning and a large reason why we can fly to a stunning number of places around the world in two hops (from major cities).
This can be both good (efficient connections, less waiting) or bad (huge crowds, long security lines, dashing to make a short connection, less time for lounges), so I thought I’d take a look at fight schedules for the past year and see when the busiest airports are ACTUALLY busy. Hopefully this will help your planning if you’re trying to avoid a pulse, or schedule an arrival during one and departure during the next to enjoy a longer lounge stay (or try a jog through the terminal!).
Crunching The Data
I took the schedule data of almost all of the top carriers worldwide for the past year. I filtered it by origin, counted how many departures were listed, counted how many seats (not passengers) each had, and sorted them into hourly buckets (so all flights departing from 2:00-2:59 pm would be in the 2 pm bucket, for example). The result was a histogram for each airport of departures throughout the day over many consecutive days and months.
Over time, this type of counting revealed when each airport was busiest on a typical day and when they are quieter. I normalized the seat and flight counts from each hour to the percent capacity, with the busiest bucket being 1 (100%) and other hours expressed as a fraction of the traffic received during the busiest hour or pulse.
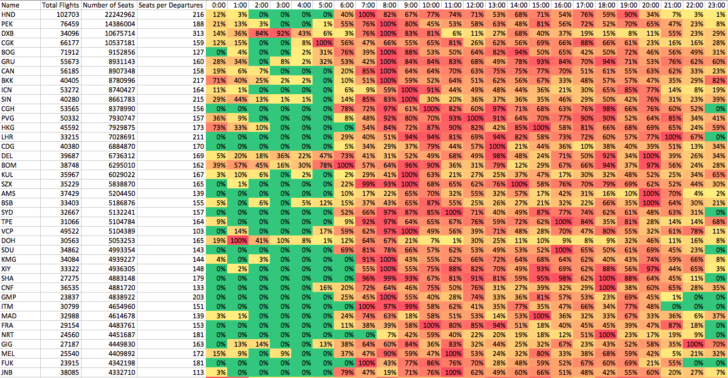
I wrote it all to a CSV file, opened it in Excel, and used conditional formatting to generate a very pretty graphic of what’s going on at each airport. Here’s what it looks like.

This yielded seats and flight counts over each hour, which I normalized to % capacity, with the busiest bucket being 1 (100%) and other hours expressed as a fraction of the traffic received during the busiest hour or pulse.
For instance, you can see that Charles De Gaulle is busiest at 1pm (across all terminals), while the next busiest period is at the 10am hour when the airport is at 79% of the 1pm peak time.
The Results
While many airports have two to three pulses during normal business hours, quite a few are VERY busy at otherwise odd times. Here are the highlights:
South America
Generally, Brazil and Peru get shafted with departure and arrival times, with much of the activity happening between 12 and 5am. Expect 2:30am transcons, huge customs lines around midnight and general malaise at weird times to be wandering an airport.
In particular, airports in the interior of Brazil have the worst experience.
Middle East
Similarly, airports in the Middle East also have weirdest rush hours. 2am is prime time in Dubai, Doha, Tel Aviv and much of Saudi Arabia. I’m guessing that airports in less wealthy parts of the world have to bid for the dregs of aircraft deployment and network planning, with the major carriers only sending aircraft to less-trafficked airports when they’d otherwise sit on the ground.
US Airports
In particular, US airports experience a huge bump right when the noise abatement ordinances lift at 5 or 6am, with a ton of departures soon after. There’s usually a bank of departures around 10am, then 1pm and a more watery one in the late afternoon, when most carriers finish up their runs at smaller airports at 6 or 7pm. There’s also a push from the larger (mostly West Coast) airports around 11pm/midnight to the East Coast and a similar push from the East Coast to Europe around the same time.
Europe Airports
European airports tend to be a bit more relaxed with their earliest departures and late-night flights. They still happen, but the pulses are less tightly organized than the US, with a more smooth distribution throughout the day. 8am and 1pm are pretty busy times, getting things going in the morning and sending most of the long-haul flights outward in the early afternoon.
Conclusion
While I could only get a measure of seats departing at any given time, this analysis neglects to address different load factors. There many be planes going out mostly empty, in which actual traffic through the airport would be lower.
I’m also open to discussing “intervention analysis” with anyone into data science. It’s a particular branch of time-series analysis and there are a few methodologies I’d be down to pick apart with a friend or two.
You can find the code and resulting spreadsheets on Github if you’d like to play around with it. Let me know if you have suggestions for further analysis or other ways to use the data. I’m all ears!

